“In small, intense tornadoes, and especially in multiple vortices, radar observations of debris may be severely underestimating air motions.” – The Center for Severe Weather Research
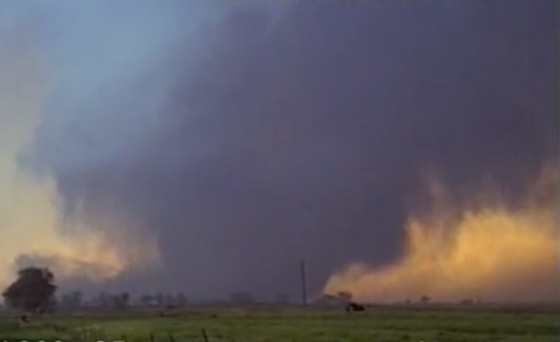
Image of the violent Spencer, South Dakota, tornado of 1998. Winds over 260 mph were recorded as the tornado obliterated 100 homes and killed six people. (StormStock)
□ Mobile doppler radar remains the only quantitative and practical technology able to analyze tornadic winds. Direct observations in winds over 200mph are next to impossible, so doppler radar allows scientists the opportunity to – from a safe distance – see behind the curtain of dirt and debris. It is important to understand, however, that doppler devices do not actually “measure” anything. Instead, they analyze the motion of debris particles within tornadoes and provide a statistical range from which tornadic wind speeds can be estimated.
Despite over two decades of active use, only a handful of violent tornadoes have ever been documented at close range. Of the tornadoes that have been tracked, only a fraction of their total path lengths were thoroughly analyzed. So doppler velocities, while useful, are by no means an objective measurement that can be used to compare or categorize individual storms.
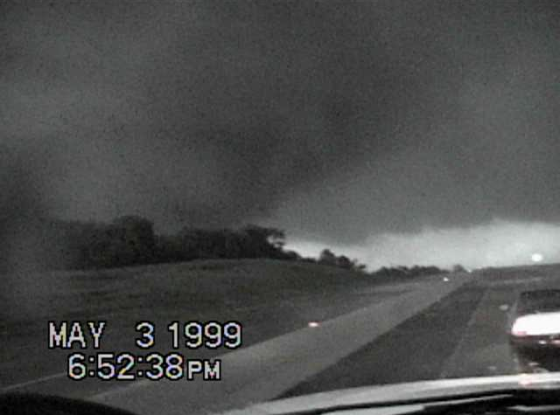
Image of the Bridge Creek tornado from the Doppler On Wheels (DOW) right as the record 300 mph+ velocity was recorded. The tornado was in the process of scouring grass and pavement from the ground in Grady County. Higher winds have undoubtedly occurred in other E/F5 tornadoes.
1. The highest reading ever recorded by mobile doppler radar was during the May 3rd, 1999, Great Plains tornado outbreak. The world-record velocity was taken just before 7pm as the F5 Bridge Creek tornado roared towards the Oklahoma City metro area. Originally calibrated at 318 mph, the reading was later reduced to 301 mph +/- 20 mph (135 +/- 10 m/s). A more accurate interpretation of the data is the statistical range the DOW estimated – 280 mph to 322 mph. At two standard deviations (2% likelihood) the measurement would be 369 mph, according to the DOW website. The reading was taken at a fairly low altitude (about 95 ft above the ground) but the surface level winds may have been slightly less – probably in the 260 to 290 mph range. At the same time, recent research in powerful hurricanes has shown that surface winds, which are generally estimated to be 10 to 15% lower than flight level winds, can actually be equal to or even exceed high altitude winds in exceptionally powerful, rapidly intensifying tropical cyclones (Uhlhorn, 2012). While these observations are specific to hurricanes, the same principle may apply to powerful tornadoes undergoing a period of rapid intensification.
The DOW does not directly measure winds but instead the movement of airborn particles. No attempt has ever been made to compare DOW observations with actual ground readings in violent tornadoes for obvious reasons. The DOW team admits that their technology likely fails to account for the many small-scale vortices that exist in strong tornadoes as well as the vertical component of tornadic winds.
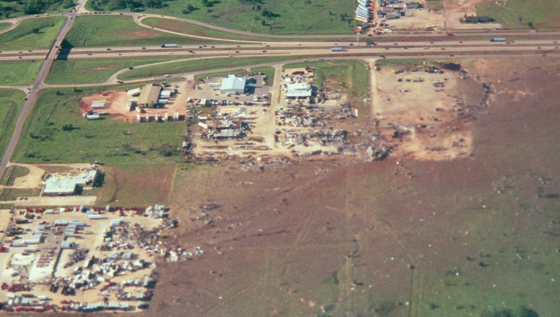
The Bridge Creek tornado caused extreme ground scouring across the majority of its path. (Image by Bob Webster)
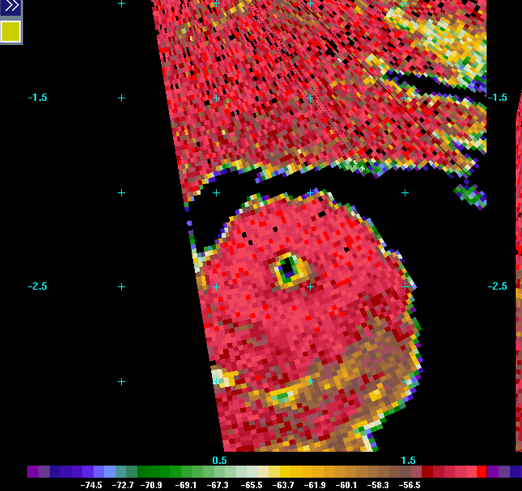
Image of the F5 tornado as analyzed by the DOW. Note the hurricane-like “eye” at center. Survivor testimony and scientific data indicates tornadoes, particularly large tornadoes, have calm centers with light winds.
2. Besides the Bridge Creek event, only one other E/F5 tornado has been analyzed by mobile doppler radar. The El Reno, Oklahoma, EF5 tornado formed on May 24th, 2011, during a large scale outbreak that also produced the deadly Joplin tornado two days earlier. The tornado killed nine people and left a streak of scoured earth as it thundered through rural areas west and north of Oklahoma City. Though still not officially made public, a rapid scanning mobile radar recorded a radial velocity of 280 mph (125 m/s) about 220 ft above ground level early in the tornado’s life. The tornado was given an EF5 rating based on the doppler measurement, and its intensity is currently quoted in NWS literature as having been “greater than 210mph” at ground level. The mobile radar team was only able to follow the tornado for part of its 65-mile long path, so it is very possible the tornado had higher winds in later stages of its life.
The El Reno tornado had a significantly longer path than the Bridge Creek tornado and may also have been more intense, though such comparison is purely speculation. The tornado became rain wrapped minutes after touching down and was obscured for much of its life. The fatality rate (the number of fatalities divided by the total number of people in the tornado’s path) in the El Reno/Piedmont tornado was significantly higher than the Bridge Creek tornado.

Severe tree and vehicle damage from the EF5 El Reno tornado. During the May 2011 tornado outbreak in Oklahoma, there were several other tornadoes that likely reached EF5 intensity. The Chickasha tornado formed one hour after the El Reno tornado and was well-documented by storm chasers. It scoured grass and pavement from the ground and likely had winds well into the EF5 range. (Image by Jim LaDue)
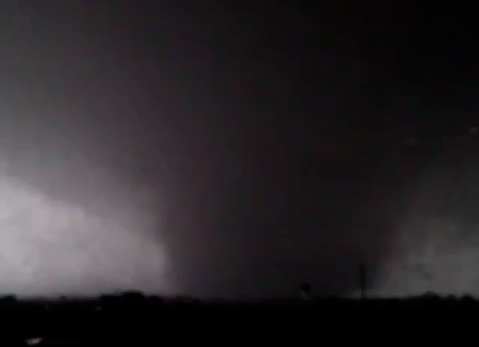
Video still of the El Reno tornado. For much of its life the EF5 tornado was a mile wide and obscurred by precipitation. (Image by JeopardyTempest)
3. The Red Rock, Oklahoma tornado on April 26th, 1991 was part of a larger outbreak that also caused the infamous Andover, Kansas F5 tornado. Of all the violent tornadoes that day, the Red Rock tornado was likely the most intense. It had the most impressive radar presentation and the longest damage path. The tornado hit very little as it roared through sparsely populated countryside and was only given an F4 rating as a result. A team headed by Howard Bluestein recorded a velocity of 268 mph in the tornado’s mature stage. This was the highest reading ever recorded using mobile doppler technology up until the Bridge Creek tornado eight years later. The Red Rock measurement was taken about 550 ft above the ground. Like most of the tornadoes tracked by mobile doppler radar, only a part of its life cycle was analyzed, and higher winds may have occurred in other stages of its development.
The Red Rock tornado was exceedingly violent, and video from storm chasers show it had some of the most impressive tornadic motion ever recorded.
4. The Spencer, South Dakota F4 tornado was followed by the DOW as it travelled generally to the east-southeast on May 30, 1998. The DOW recorded ground relative wind-speeds as high as 264 mph (118 m/s) close to the time the tornado passed through the small town of Spencer (Wurman, 2005). The measurement was taken at a fairly low altitude – 160 ft – but still well above what the NWS constitues as “ground level.” Only a tiny section of the tornado’s path crossed over man-made structures, so the tornado’s true damage potential was likely not realized. It was given an F4 rating after a damage survey was conducted, but many researchers believe the tornado had F5 potential. Six fatalities occurred in Spencer, five of them in a two story apartment building that was obliterated.
An interesting feature of the Spencer tornado was revealed when the DOW measurements were compared with a ground damage survey. The tornado was shown to have a pronounced eye, and much like a hurricane, the winds on the right side of the tornado were significantly stronger than the winds on the left side due to the addition of the tornado’s forward momentum (Wurman, 2005). The high-end F4 damage was all south of the torndo’s center whereas areas north of the eye had lighter (F1 – F2) damage. According to the DOW analysis, the worst affected areas in Spencer experienced hurricane force winds for two minutes and violent (200mph+) winds for about 20 seconds. The tornado was often obscurred by dust, but video from storm chasers show that the storm had extremely rapid rotation.
5. The Mulhall, Oklahoma tornado occurred on the same day as the Bridge Creek tornado on May 3rd, 1999. Several researchers believe this tornado was more violent than its infamous cousin, and the DOW measurements revealed the Mulhall tornado was significantly larger. The DOW estimated a velocity of 257 mph (115 m/s) and one CSWR article mention readings of 277 mph to 299 mph in regards to this tornado. The veracity and context of the higher readings is unknown (DOW Measurements of Extreme Winds…, 2003). The Mulhall tornado’s extreme winds formed a giant circle one mile across with a large, calm eye at center. The tornado had hurricane force winds extending over an area four miles across, making it the largest tornado ever analyzed by the DOW. The tornado only caused two fatalities as it swept through largely rural areas north of Oklahoma City, but the storm had the potential to produce a huge swath of E/F4 to E/F5 damage had it struck a heavily populated area.
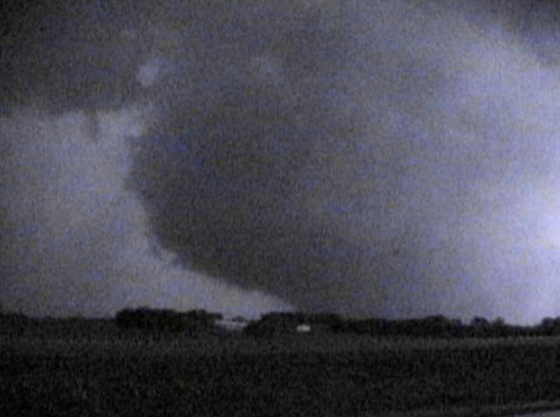
Image of the Mulhall tornado taken from the DOW. The tornado was rated F4, but had it passed over more structures it likely would have received an F5 rating.
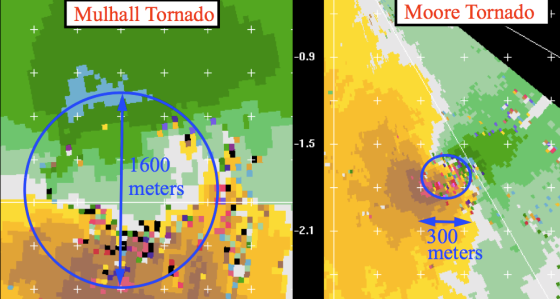
Equal area comparison between the Mulhall and Bridge Creek tornadoes from cswr.org. The Mulhall tornado had similar but slightly weaker winds at the time of analysis but the size of the tornado was remarkable. The tornado’s core missed the center of Mulhall by nearly a mile but the broad region of winds caused severe damage across the town.
Measurements from mobile doppler radars taken before 2007 were often in agreement with the now unused Fujita Scale. Even when the estimates are reduced by 10 to 15% to account for possible altitude effects, the velocities were in agreement with the Fujita Scale. The DOW often found winds higher than the tornado’s damage indicated. Popular opinion now emphasizes being as conservative as possible when estimating tornado windspeeds. The new “Enhanced Fujita Scale” is more specific in its description of tornado damage indicators, but the reduced windspeed ranges likely underestimate the surface winds in violent tornadoes.


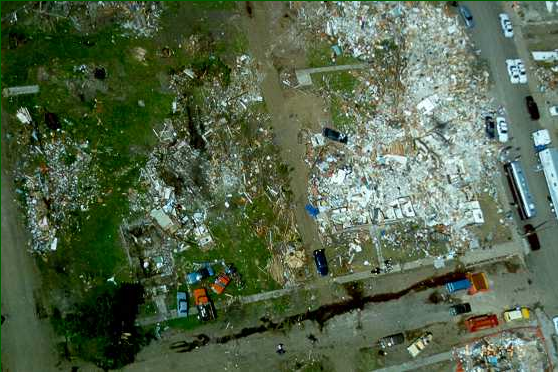
Just an FYI, a DOW is a specific radar belonging to a specific group of researchers. “DOW” is not a generic, catch-all name. The measurements made in #2 and #3 were not by DOWs, but by other mobile radars. I believe #2 was made by OU’s RaXPol and #3 by an OU FM-CW radar.
Frankly, I don’t know a tremendous amount about the technical terms for the DOW/Rapid Scanning Doppler Radars as I don’t think the velocities they record are incredibly useful. I finally was able to verify the El Reno reading of 125 m/s and thought people should know. I was getting a bit annoyed by the reluctance of people to officially release the figure.
But I can change it. Trying to think of a more generic name.
I think “mobile doppler” is a good genieric term.
I am curious, though, as to why so many sources claim that the wind in the Bridge Creek/Moore tornado was recorded at 318 mph. I’ve also seen people claiming speeds up to 327.
It was initially reported as 318mph + or – 20mph but later calibrated as 301mph + or – 20mph. Such changes are further evidence of the variability in analyzing data from doppler radar. A certain level of subjectivity enters into the equation frequently when researchers estimate the highest winds by adding the forward speed, rotational velocity and influence of suction spots. Many readings are not taken directly but instead found in this manner.
I do admit my knowledge of the statistical analysis behind doppler radar observations is less than some, but this is my understanding after reading all of the peer-reviewed articles written by the CSWR.
I’ve noticed a few recent tornadoes were rated based on Doppler radar such as this one. http://www.crh.noaa.gov/news/display_cmsstory.php?wfo=top&storyid=94990&source=0
I’d like to hear your take on it. I don’t like it personally, since we still don’t know how the winds correspond to the DOD’s.
Do you happen to know the highest recorded or estimated surface wind speed in a tornado? Maybe within 50 feet of ground level?
The highest ascertained velocities are the ones shown above + El Reno 2013. Adjusting some of the readings to the surface would still likely yield winds in excess of 270mph. As for actual surface readings with an anemometer, I know that one station in Tecumseh in 1965 and another near El Reno in 2011 both recorded wind gusts of 151mph in the periphery of a violent tornado.
In reality, peak tornadic winds at the surface can likely surpass 300mph in rare instances.
Does this mean that the Muhall tornado could have had one of the widest damage paths with extreme winds if it had hit more populated zones? Usually extreme damage is confined to 100’s of yards but since you said extreme winds were a mile long around a calm eye, could the path of EF5 damage extended for around a mile in width as well if it had hit a populated area?
The doppler data makes it seem like the Mulhall tornado could have left a mile+ wide swath of EF4+ damage, but I’d want a damage survey before giving a definitive answer. Surveying the El Reno tornado really taught me that damage should come first and foremost before radar data – though some would disagree with me on that.
The Jarrell tornado left a path of scoured grass and empty foundations more than half a mile wide. That’s the widest swath of violent tornado damage I know of.
I might also suspect that EF5 winds would be largely confined to the suction vortices, or at least to the right side of the tornado.
Do you happen to know if they got a reading higher than 280 mph in the el reno tornado? I saw a recent simulation that was based off of data from that tornado and somewhere it involved winds that might’ve been 320mph at the surface. Is that also an official recording that wasn’t made public and would that have been when it hit the oil rig?
Xenia, Ohio 1974 had winds of 318 mph. No mention of it.
NOAA, NWS, Tetsuya Fujita, and the University of Chicago Severe Thunderstorms Research Team, capped it at 318 mph at the top of the F5 scale. Theoretically, Fujita believed it was higher but had no way to absolutely measure wind speed. F rating was based on destruction surveys. Photogrammetry studies done in 1975 measured 303 mph +/- 20 mph. (expected wind speed range / 283 to 323 mph)
I recently uploaded my video to Youtube. Here is the link, its not that great quality as I’m still a new Youtuber.
The list is post-1990.
I also give you a shout out in the description of the video.
I read somewhere today that the Mulhal tornado was doing damage that didn’t classify in regular damage categories, and that people had never seen before. Not 100% sure what they meant by that though.
Interesting tidbit from the Wikipedia article about the 2013 Bennington KS tornado:
“Initially, the tornado was rated as an EF4, with the rating based on Doppler on Wheels surface wind measurements, which indicated a far larger and stronger tornado. Gusts were measured far into the EF5 intensity range, with a peak value of 247 mph (398 km/h); however, those winds were measured 300 ft (91 m) above the surface. However, DOW windspeed measurements were found to be almost 264 mph (47m above ground level).”
Not sure how true or verified this is, but none the less, it is interesting.