

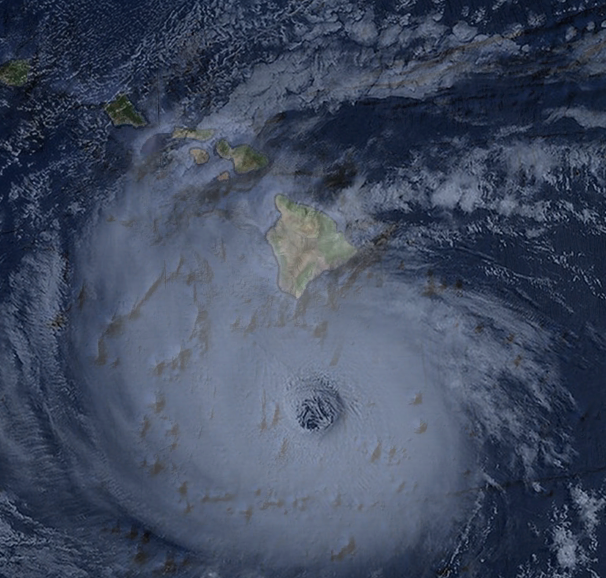
In August of 1994, Hurricane John became the most powerful hurricane in Central Pacific history as it passed south of the Hawaiian Islands (the Big Island is visible at top center). At peak intensity, the category 5 storm had surface winds of 175mph and gusts in excess of 200mph (CPHC, 1994).
Meteorologists once believed that the Hawaiian Islands were largely protected from hurricanes due to their unique position in the Central Pacific Ocean. Despite residing entirely within the tropics, the island chain is well north of the Intertropical Convergence Zone and within close proximity to an area of cool water which inhibits tropical cyclone development. A semi-permanent high pressure ridge north of the state also helps protect the islands from storms that deviate from the hurricane belt to the south. Additionally, massive shield volcanoes in excess of 13,000ft on the Big Island appear to act as natural buffers against hurricanes traveling from the Eastern Pacific. The influence of the island’s topography was widely noted following the rapid decay of several notable hurricanes, including Hurricane Jimena in 2003 and Hurricane Flossie in 2007.
In general, Hawaii very rarely experience significant affects from tropical cyclones beyond large surf. Full-fledged hurricane force winds (disregarding mountainous locations) have only affected the islands on three occasions. Historical records indicate that Kauai is by far the most vulnerable major island to hurricane impacts. The island of Oahu, where 70% of the state’s population resides, is the second most vulnerable location in the state due to its proximity to Kauai. The other islands, with the exception of the southern tip of the Big Island, have largely escaped serious damage since official record keeping began in 1950. It is likely, however, that every area of the state has been impacted by hurricanes over a wider time scale.
Below is a list of tropical cyclones that have seriously impacted the state since 1950. Storms that caused damage solely through large surf, such as Hurricane Estelle in 1986, are not included.
August, 1950 – Hurricane Hiki

Hurricane Hiki was the first operationally verified tropical cyclone to affect the Hawaiian Islands. The unusually small hurricane brought tropical storm force winds to the northern coasts of several islands. Pictured is an illustration of the storm north of Kauai. Reconnaissance flights found that the storm’s eye was filled with clouds and approximately 20 miles wide (CPHC, 2013).
□ In 1950, the Joint Hurricane Warning Center began implementing a naming scheme for tropical cyclones in the Central Pacific. In August of that year, a tropical storm was identified southeast of the islands. The “immature storm” crossed several shipping lanes and strengthened despite passing through generally unfavorable waters east of the Big Island. A reconnaissance flight was sent to investigate the approaching storm, and the data indicated that the system was a full-fledged tropical storm with surface winds in excess of 50mph (CPHC, 2013). The system was given the name Hiki, the Hawaiian conversion of the military name Alpha. Gale warning were posted for the western islands as large waves began to crash onto the Hilo coastline (Star Bulletin, 1950).
On August 15th, Tropical Storm Hiki’s center passed approximately 100 miles north of the Big Island. The storm had an unusually small wind-field, so only minor damage was reported along the northern coastline (Star Bulletin, 1950). Winds were strong enough to fell a power-line in Kohala, however, and a 58-year old man was killed after coming into contact with a live wire. The system continued to intensify as it skirted past the island chain and attained hurricane intensity north of Molokai on August 16th. Parts of Oahu encountered tropical storm force winds, and minor power outages from downed tree branches were reported in Kaneohe and Manoa Valley (Star Bulletin, 1950). On the evening of August 15th, Hurricane Hiki came within 100 miles of Kauai. Sustained winds greater than 35mph and torrential rains battered the island. A total of 253 people were evacuated when a nighttime flash-flood caused the Waimea River to burst its banks. A wind gust of 68mph was recorded at Kilauea Lighthouse on Kauai’s northern coast, the highest terrestrial gust reported in the storm.

Newspaper articles on Hurricane Hiki showed the eye of the storm passing closer to the islands than the current official track.
A high pressure ridge north of Hawaii slowed Hurricane Hiki’s forward movement on August 16th and began pushing its center to the southwest. Although the storm never made landfall, Kauai experienced the outer edges of Hurricane Hiki for more than four days. A weather station on the slopes of Mt. Waialeale recorded the heaviest rainfall ever associated with a tropical cyclone in US history. A total of 52 inches of rain was reported, with the majority of the precipitation falling on August 16th and 17th. Since the rain gauge had to be manually emptied every 24 hours, the container overflowed twice and likely failed to measure all of the precipitation (CPHC Archives).
Hiki maintained hurricane intensity for four days and had maximum surface winds of 85mph. Unlike the majority of tropical cyclones that have caused damage in Hawaii, Hurricane Hiki tracked north of the islands and strengthened despite passing within 150 miles of the Big Island’s tall mountain peaks. While hurricanes affecting the islands’ northern coasts are rare, a similar but more destructive tropical cyclone in 1871 may have brought hurricane force winds to the Big Island and Maui.

Star Bulletin image of flooding in Waimea Valley on Kauai.
December, 1957 – Hurricane Nina

Hurricane Nina was a large, late-season tropical cyclone that brought wind gusts in excess of 80mph to Kauai and Oahu. Pictured is an illustration of the storm at closest approach to the islands. According to reconnaissance flights, the storm had a cloud-filled eye and spawned unusually large ocean waves in excess of 50ft.
□ On November 29, 1957, a late-season tropical cyclone developed only a few hundred miles north of the equator. A weather station on Palmyra Island recorded a peak gust of 70mph as the storm passed over the area and tracked to the north. On November 30th, a reconnaissance flight determined that the system was of hurricane intensity and centered 500 miles north of Palmyra Island, where squally weather was still occurring (CPHC, 1957). The storm, which was given the name Nina, was forecast to continue northward towards the Hawaiian Islands. Gale warnings were issued for the islands of Niihau, Kauai and Oahu.
Hurricane Nina began curving away from the islands and made an abrupt turn to the west while centered 120 miles east-southeast of Kauai. A reconnaissance flights found that Hurricane Nina had a cloud-filled eye and massive seas that were so large, according to one pilot, that “nothing but a huge ship could live in that wild stuff” (Star Bulletin, 1957). Despite never making landfall, the category 1 storm brought hurricane force wind gusts and heavy rain to the islands of Kauai and Oahu. The most severe conditions occurred on Kauai, where more than 1,400 people were forced to take shelter at evacuation centers (Star Bulletin, 1957). An anemometer at Kilauea Lighthouse recorded a peak gust of 92mph at 8pm on December 1st (Star Bulletin, 1957). The winds shattered windows and uprooted trees across the island. On Kauai’s southern coast, massive 35ft waves severely damaged more than a dozen homes. Additionally, 20.4 inches of rain fell in 14 hours in Wainiha, resulting in a river flood which damaged a twin-span bridge (Star Bulletin, 1957). West of Kauai, a 43ft sampan capsized in stormy seas, resulting in three fatalities.

Hurricane Nina was the first tropical storm in modern history to bring hurricane force wind gusts to the Hawaiian Islands. In the above image, a residence a mile north of Honolulu International Airport was crushed by a neighboring home’s roof.
Oahu was farther from the center of the storm but still experienced damaging winds. Hundreds of homes and businesses were damaged by winds across the island, including more than a dozen homes that were unroofed. Gusts of 70mph buffeted the southern half of the island, and Honolulu International Airport experienced a record gust of 82mph (Star Bulletin, 1957). Four concrete light posts in Waikiki were knocked down onto Ala Wai Boulevard and several show-windows in downtown Honolulu were blown out (Star Bulletin, 1957). One death occurred on Oahu when a man was electrocuted by a fallen power line (Star Bulletin, 1957).
Hurricane Nina travelled westward and away from the state on December 3rd, leaving behind three direct fatalities and at least $4 million (2012 dollars) in damage. The storm was the last of three hurricanes to come within close proximity of the state in the 1957 season, one of the most active in recent history.

The outer rain-bands of Hurricane Nina led to periods of intense winds across Oahu, damaging hundreds of homes (Star Bulletin, 1957).
August, 1958 – Unnamed Tropical Storm

The most significant tropical cyclone to impact the state of Hawaii without attaining hurricane intensity made landfall on the Big Island in 1958. Pictured is an illustration of the storm at landfall utilizing a satellite image of Tropical Storm Flossie in 2013.
□ One of the most significant yet forgotten tropical cyclones in Hawaiian history formed east of the Big Island in August of 1958. No records exist of the storm’s formation, so the official track has the system suddenly developing only a few miles offshore. According to the NHC database, the storm made landfall on the Hamakua coastline with sustained winds of 50mph on the evening of August 7th. Heavy rain and gusty winds began affecting Hilo in the predawn hours. Strong crosswinds interrupted operations at Hilo Airport, and one man died when a small plane crashed in the midst of the storm (Star Bulletin, 1958). The Big Island’s complex topography led to great variability in surface winds – some areas experienced sustained winds over 55mph while other locations encountered only breezy conditions. Damage patterns indicated that wind gusts in excess of 85mph occurred in some vulnerable areas (CPHC, 2013).
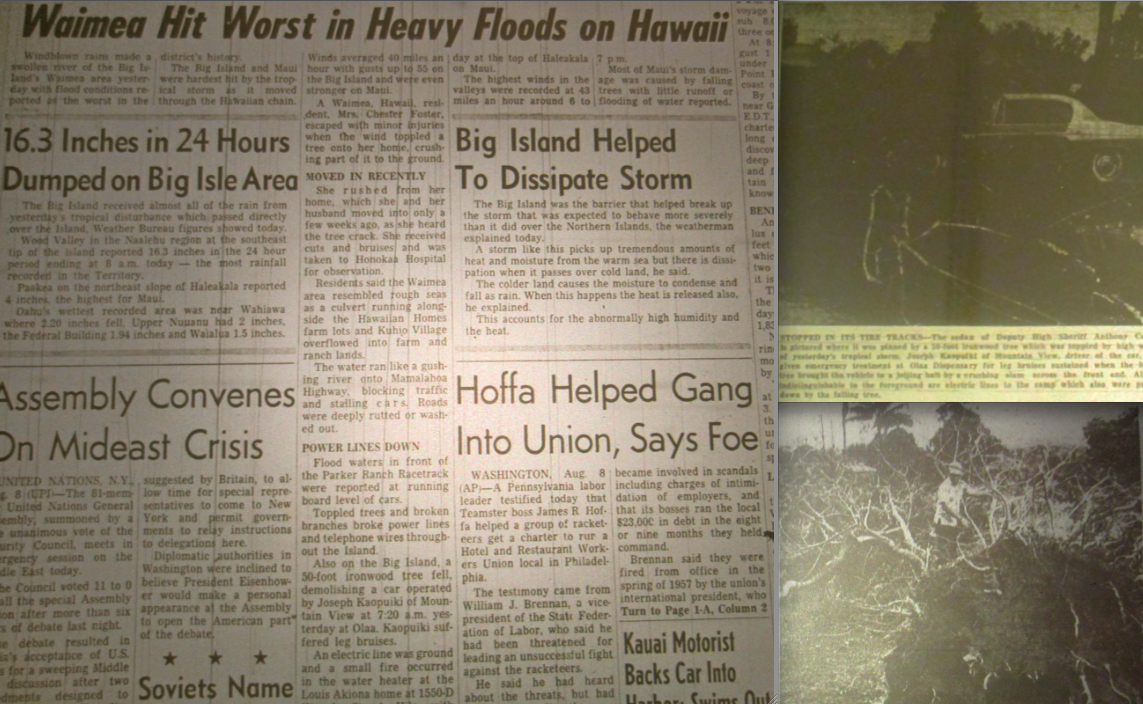
The town of Waimea, which rests 2,500ft above sea level on Kohala Mountain, may have experienced the most severe conditions during the storm. Torrential rain caused extensive flooding in town and one woman was injured when high winds blew a tree onto her home. In Hilo, high winds toppled a 50ft pine tree onto a police cruiser, injuring a passenger (top right). In Kailua-Kona, winds uprooted trees and caused some property damage (bottom right).
Tropical storm force conditions affected a large portion of the island. In Honokaa, a large garage was ripped from its anchorage and moved several feet by high winds (Tribune Herald, 1958). The town of Waimea, located on an elevated saddle between Mauna Kea and Kohala Mountain, was buffeted by wind gusts in excess of 55mph and flooding rains. Cars stalled as water gushed down Mamalahoa Highway, and “roads were deeply rotted or washed out” along the mountain slopes (Star Bulletin, 1958). Farther south in Kona, wind gusts reportedly reached up to 75mph, snapping Keawe trees and sending outdoor patio furniture tumbling through the streets (Tribune Herald, 1958).
The tropical storm traversed the Big Island in only a few hours and re-entered the ocean just after midnight. While the official track indicates the storm weakened into a tropical depression, gale force winds were recorded at several locations on August 8th. Gusts over 55mph affected portions of Maui, Lanai, Molokai and Oahu, and sustained winds of 60mph with gusts to 75mph were recorded on the summit of Haleakala (Star Bulletin, 1958). Heavy rains fell over all of the major islands, causing a damaging landslide on Oahu. On August 9th, the weakening tropical depression dissipated 130 miles south of Niihau.

The 1958 tropical storm brought stormy conditions to the majority of the state. Heavy rainfall led to landslides on Tantalus on Oahu, destroying a road and several utility poles (Luke, 1958). The 1958 storm, along with Hurricane Iselle in 2014, are the only tropical cyclone to make landfall on an island other than Kauai since modern record keeping began in the Central Pacific. Both storms struck the east coast of the Big Island as tropical storms.
August, 1959 – Hurricane Dot
Hurricane Dot passed 90 miles south of the Big Island as a category 4 hurricane before turning to the northwest and making landfall on Kauai with winds of 90mph. Pictured is an illustration of the storm just after midnight on August 5th. Reconnaissance flights determined that the hurricane had an unusually large eye, ranging between 35 and 40 miles in diameter.
□ The specifics surrounding the development of Hurricane Dot remain unknown. The system likely formed in late-July but was not officially documented until August 1st, when a ship reported hurricane force winds approximately 950 miles east-southeast of the Big Island. On August 3rd, the first reconnaissance flight intercepted Hurricane Dot and reported estimated surface winds of 150mph, making the storm a powerful category 4 hurricane. The storm’s central pressure remained unusually high in relation to its winds, never falling below 952mb during flight intercepts. One mission reported sustained winds of 160mph and a central pressure of 966mb (CPHC Archives, 2013).

Radar view of Hurricane Dot on the evening of August 4th as captured by a US Air Force reconnaissance flight. The image is superimposed over a map of the storm’s likely location.
Hurricane Dot maintained category 4 intensity as it tracked westward towards the Hawaiian Islands. On August 4th, models suggested that the hurricane would brush past the Big Island and remain south of the other islands (Star Bulletin, 1959). Gale warnings were issued for the Big Island, and the outer rain-bands of the storm began affecting the coastline after sunset on August 4th. Unlike other hurricanes that have followed similar tracks, Hurricane Dot did not weaken as it came under the influence of the Big Island’s towering mountain peaks. The storm’s center came within 90 miles of South Point, bringing tropical storm force conditions to a large portion of the island.
Sustained winds of 60mph with gusts to 85mph were recorded at South Point in the early morning hours. Journalists at a station in South Point later reported that their bunker was buffeted by high winds that snapped a radio antenna and nearly ripped a door from its hinges (Star Bulletin, 1959). Farther north, heavy rains flooded streams and waterfalls near Hilo (Star Bulletin, 1959). Additionally, massive 40ft waves damaged roads and agricultural buildings along the sparsely populated southeast coast (Star Bulletin, 1959). As the storm’s eye travelled past the island, huge swells propagated northward towards the West Hawaii shoreline. Waves up to 35ft pummeled the populated Kona coast, damaging hundreds of beachfront properties. The famed little grass shack at the Kona Inn was swept out to sea, and several hotel pools were deemed “total losses” (Star Bulletin, 1959). On Maui, giant waves damaged coastal property and a gust of 52mph was recorded at the Kahului airport (Star Bulletin, 1959).

Thirty-five-foot waves were recorded on the normally calm southwestern shores of the Big Island. Properties along Alii Drive (pictured above) experienced varying degrees of damage. According to local residents, the storm waves broke far offshore in a manner never seen before (Star Bulletin, 1959).
Hurricane Dot’s winds dropped to 115mph as the storm executed an unexpected turn to the northwest. In the early morning hours of August 6th, tropical storm force winds began to affect parts of Oahu. A gust of 63mph was recorded at the Honolulu Airport around noon. Thirty-foot waves pounded against the entrance to Honolulu harbor, leading to its closure at 1pm (Stewart, 1959). Damaging winds affected most of the island but the most severe affects were reported on the exposed Wai’anae coastline, where several homes were completely unroofed (Black, 1959).
Updated forecasts predicted that Hurricane Dot’s center would pass through the Kauai Channel. The eye of the storm, however, passed directly over the island of Kauai on the night of August 6th with sustained winds of 90mph. Winds across the island began increasing rapidly around 4pm, and the full fury of the storm reached Lihue around sunset. The first half of the storm brought hurricane force winds to much of the island, leveling poorly built structures and felling thousands of trees. Forty-foot waves filled with debris from swollen rivers pounded Kauai’s southern coast, flooding the Coco Palms Hotel with more than 4ft of wind driven surge (Star Bulletin, 1959). Kilauea Lighthouse reported sustained winds of 81mph with a peak gust of 103mph (CPHC Archives, 1959).

A beach in Poipu was inundated by Hurricane Dot’s storm tide and left covered in debris.
At 7:15pm, the storm’s 40-mile wide eye reached the island. A yacht in Hanlei Bay reported seeing a “bright starlit sky,” indicating Hurricane Dot’s eye was clear. An hour later, the back eyewall passed over the island, though it was reportedly less fierce than the first half of the storm. Just after midnight, the skies cleared above Kauai as Dot weakened back to a tropical storm and tracked off to the west-northwest. In its wake, the storm left approximately $56 million in damage (adjusted for inflation) across the state, primarily as a result of agricultural losses on Kauai. A similar storm today would likely cause over $1 billion in damage.
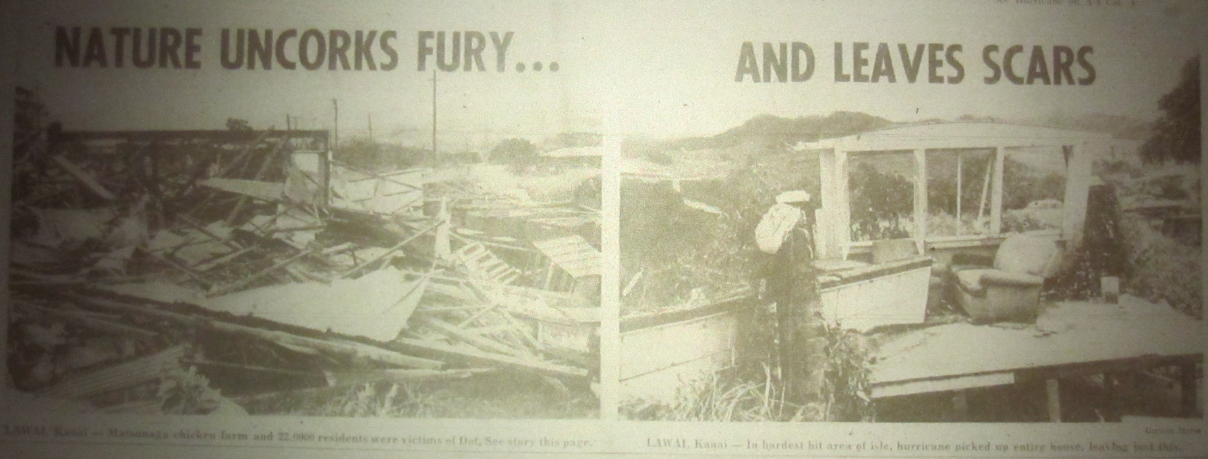
High winds from Hurricane Dot destroyed hundreds of buildings on Kauai.
November, 1982 – Hurricane Iwa

Hurricane Iwa was the second most destructive tropical cyclone in Hawaiian history. Despite passing just west of Niihau, the storm caused severe damage on the islands of Kauai and Oahu.
□ Amidst a powerful El Nino episode in 1982, an unusual late-season tropical storm developed far southwest of the Hawaiian Islands. The system tracked slowly northward and became Hurricane Iwa on the evening of November 22nd. The slow-moving system rapidly gained forward speed as it interacted with strong upper-level winds, causing the storm’s path to shift towards the islands of Niihau and Kauai. Hurricane Iwa’s sustained winds peaked at 90mph before gradually weakened as the storm rapidly approached the state. On November 23rd, the storm’s center passed only 25 miles west of the Napali Coast. Despite never making landfall, the exceptionally large storm caused severe damage to the western half of the state.

Hurricane Iwa battering Poipu, Kauai, with 35ft waves and wind gusts in excess of 90mph. While the storm’s sustained winds decreased to 80mph upon closest approach to the state, the system’s rapid forward pace increased the wind velocity over the islands.
Due to the Hurricane Iwa’s exceptional forward speed of 40mph, conditions within the dangerous right-front quadrant of the storm were intensified but of decreased duration. On Kauai, sustained winds averaged approximately 60 to 75mph but varied greatly due to local topography. In Poipu, giant waves and a six-foot storm surge completely destroyed dozens of oceanfront properties. In Lihue, hundreds of buildings were damaged and several businesses were destroyed by high winds. The most intense winds documented on the island occurred on the northern coast in Princeville, where peak gusts may have reached 120mph (Chiu, 1983).
Hurricane Iwa’s unusually large wind-field also brought damaging winds to Oahu. Most of the island experienced hurricane force wind gusts, and variations in local topography led to significantly stronger winds in downslope areas. The most intense winds on Oahu occurred primarily in a 40 minute period in the early evening as a heavy squall line passed over the island, but sustained winds in excess of 40mph affected the island for seven hours (Chiu, 1983). Honolulu Airport recorded winds of 49mph with a peak gust of 84mph (adjusted to 46mph and 81mph at 30ft elevation). Winds in the central valley were higher, with sustained readings averaging around 60mph. A dozen large warehouses at Schofield Barracks were damaged or destroyed. The most intense winds reported on the island occurred on the northern slopes of the Ko’olau Mountains. A US Air Force station in Kaneohe recorded sustained winds of 69mph with a peak gust of 112mph, the highest gust reported on Oahu (Chiu, 1983). Large waves and a modest storm surge destroyed homes in Wai’anae and flooded the streets of Waikiki. One seaman was killed when a Navy destroyer was struck by a large wave just outside of Pearl Harbor (CPHC, 2013).

Hundreds of homes on Kauai and Oahu were completely destroyed by Iwa’s fierce winds. The storm’s winds had an unusually high gust ratio, meaning wind gusts were higher than would be expected considering the storm’s official intensity.

At left, the bottom level of a beachfront complex in Poipu was gutted by Hurricane Iwa’s storm surge. At right, destroyed buildings at Schofield Barracks on Oahu, where winds were funneled down the Wai’anae Range. (Image by Y. Ishii)
September, 1992 – Hurricane Iniki

Hurricane Iniki was by far the most intense tropical cyclone to affect Hawaii since the turn of the 20th century.
□ During the unusually active 1992 Central Pacific Hurricane season, Tropical Storm Iniki developed far southeast of Hawaii in the Intertropical Convergence Zone. The Central Pacific Hurricane Center initially did not consider the storm a threat as it slowly organized and travelled due west through unusually favorable atmospheric conditions. On September 9th, Iniki attained hurricane status 450 miles southeast of the Big Island (CPHC, 2013). While most tropical cyclones remain well south of the islands, an unseasonal low pressure system in the Northwest Pacific caused Hurricane Iniki to slow down almost due south of Oahu. During the overnight hours of September 10th, the storm made an abrupt turn to the north and began accelerating towards the western islands. Hurricane Iniki reached an intensity maxima approximately 130 miles south of Kauai on the morning of September 11th. A reconnaissance flight found sustained surface winds of 145mph and a central pressure of 938mb, making Hurricane Iniki a powerful category 4 hurricane and the most intense storm ever documented in the Central Pacific at the time (CPHC, 2013).
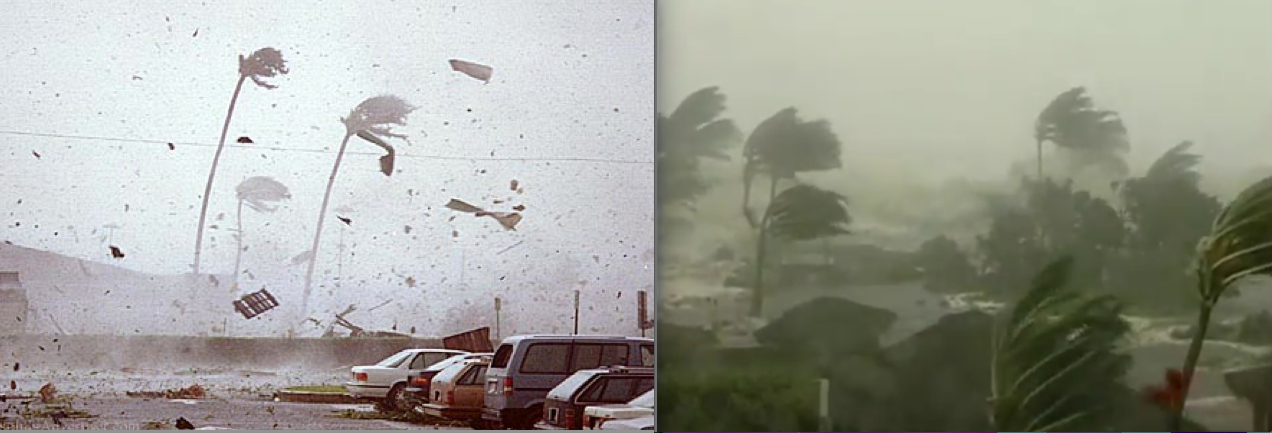
Hurricane Iniki made landfall in the early afternoon, allowing dozens of videographers to document the storm. At left, wind gusts in excess of 130mph ravage Lihue (Image by Bruce Asato). At right, footage of a large surge-driven wave inundating a resort in Poipu.
Iniki entered a gradual weakening trend around 10am but maintained category 4 status as it sped northward at 25mph. At 3:30pm, Hurricane Iniki’s eye came ashore and traversed the western half of the island, leaving most of Kauai’s population within the dangerous right hemisphere of the storm. The exact intensity of Hurricane Iniki’s winds at landfall is unclear, but estimates range between 130 and 145mph. Considering the storm’s terrestrial pressure of 945mb, rapid forward pace and impressive satellite presentation, it is likely some portions of the island experienced category 4-force winds. An anemometer at Lihue Airport “pegged” at the instrument’s top value of 117mph in both the front and back eyewall of the hurricane, leading researchers to estimate a peak gust of 129mph (NOAA, 1993). The highest official wind gust recorded on Kauai was 143mph at Point Makahuena, but gusts over 160mph were estimated across the island. Vegetation was stripped bare on the slopes of Mount Waialaealae, indicating winds may have topped 200mph in certain mountainous locations. On Oahu, winds were generally moderate, but gusts of 82mph reportedly affected the Waianae coast (Survey Report, 1993).

At left, extreme wind and storm surge damage near Poipu (Image by Nick Galante). At right, a severely damaged oceanfront complex on Kauai. The high water mark is visible behind the building (Image by Reed Saxon). Due to steep underwater topography, storm surge heights tend to be lower in Hawaii than other areas in the United States. The deep waters offshore do little to diminish swell energy, however, leading to large coastal waves.
Hurricane Iniki caused storm surge heights of up to six-feet on Kauai’s southern coast. Breaking waves over 35ft, however, led to high water marks over 22ft above sea level (Survey Report, 1993). On Oahu, a high water mark of 19ft was recorded at Makaha Shores, but most of the island encountered storm tides under four-feet. The remainder of the state was battered by giant surf, damaging or destroying hundreds of boats sheltering in normally calm southwest-facing harbors.
In total, Hurricane Iniki caused five direct fatalities – one man was killed by flying debris, one woman was crushed by a collapsing home and three people drowned in boats off Kauai (Survey Report, 1993). The monetary scope of the damage, amounting to approximately $3.5 billion (adjusted for inflation), was unprecedented in Hawaiian history. On Kauai, 1,421 homes were destroyed, primarily due to high winds, and the remainder of the island’s buildings were damaged to some degree (CPHC, 2013). The storm remains the most intense tropical cyclone to impact the Hawaiian Islands and proof that major hurricanes are capable of striking anywhere in the tropics of the Central Pacific.
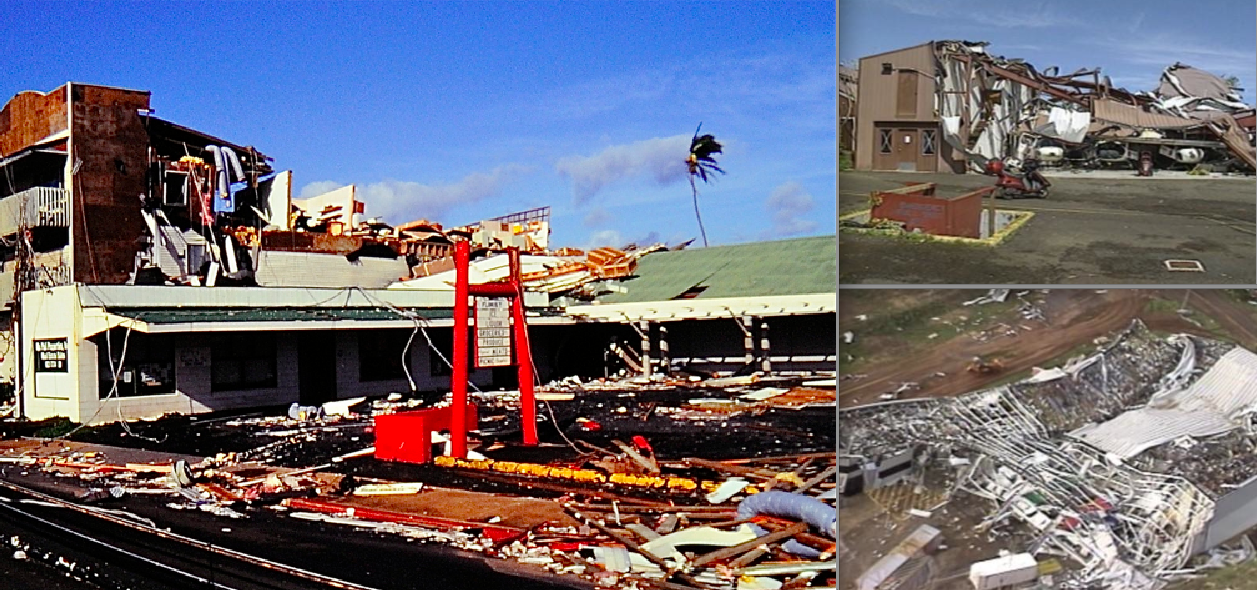
Hurricane Iniki caused some of the most severe wind damage ever photographed in the United States. At left, severe damage to buildings in central Lihue (Image by Brian Howell). At right, industrial buildings were reduced to piles of twisted metal.


