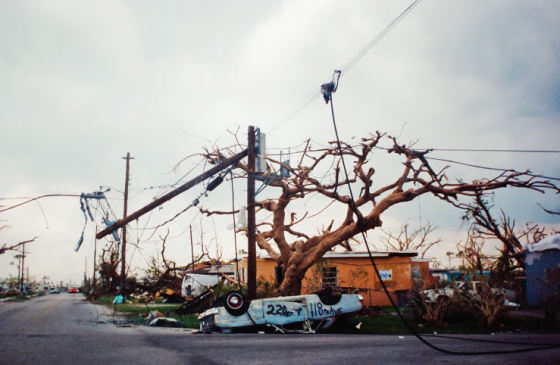
Hurricane Andrew was the most damaging single windstorm in world history. Whereas most catastrophic hurricanes are defined by their storm surges and flooding, Andrew proved that the winds in tropical cyclones can be just as devastating. (Image courtesy of Michael Laca)
After decades of relative inactivity in the Atlantic basin, Hurricane Andrew marked the first time in modern history that a Category 4 or Category 5 hurricane had directly threatened a large American city. As people across the country watched, the tightly wound storm took aim on downtown Miami. On August 23rd, 1992, journalists and camera crews positioned themselves in iconic areas throughout the city. By 1am on August 24th, winds were howling across Dade County. Employees at the National Hurricane Center, then located in Coral Gables, had the dual task of monitoring the storm and protecting themselves as windows shattered in the upper floors of their building.

Hurricane Andrew strengthened up until, and slightly after, its South Florida landfall. The storm was extremely well shaped, and easily had the most intense and symmetrical eyewall ever captured up-close by land-based radar.
At the break of dawn, the eye of the storm was entering the Gulf of Mexico and the winds across Dade County had begun to die down. Daylight revealed extensive damage across the city of Miami and Coral Gables. Strangely, however, there was little word from areas farther south. A last minute dip in the storm’s path meant that the urbanized areas south of Miami, from Kendall to Florida City, had taken the brunt of the storm. Despite the widespread use of video cameras in the early 90’s, no clear footage exists of the storm at its height. Nearly all of the videos taken south of 152nd Street end abruptly at 4am.
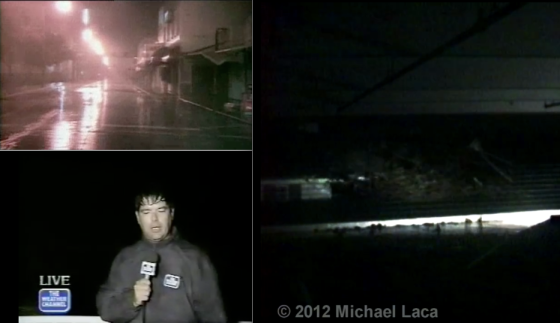
Few videos exist of Hurricane Andrew’s landfall in Dade County. At top left, a clip from a journalist and his cameraman as they filmed the hurricane throughout the city, spending the majority of the storm on South Beach. At bottom left, Dennis Smith from the Weather Channel broadcast live footage of the hurricane in Coral Gables. At right, storm chaser Michael Laca recorded the duration of the storm in Coconut Grove. All three of these films were taken well north of the worst affected areas.
News helicopters and emergency crews quickly realized the extent of the damage. Cities to the south of Miami had taken the full force of the Category 5 hurricane, leaving tens of thousands of people homeless. Nearly everyone who lived south of 152nd Street seemed to agree that “something unusual happened” between 4am and 6am the morning of August 24th. In the words of one Homestead resident –“I’ve been through plenty of hurricanes, and all of them together was nothing compared to this.”
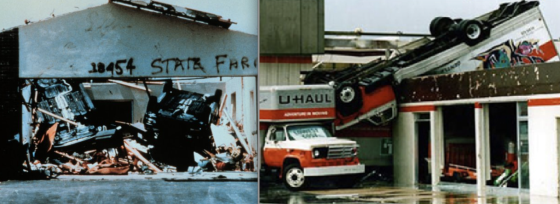
Tests in wind tunnels have found that winds of 130mph are required to overturn a minivan at its most sensitive angle, and winds of 150mph to 180mph are needed for them to be flipped at other angles (Schmidlin, 2003). Hurricane Andrew overturned more cars than any hurricane in history. At left, two vehicles in Homestead were flipped end over end inside a garage. At right, a U-Haul truck was blown atop the roof of a building. In both cases, the proximity of the vehicles to buildings likely contributed to their movements. (NOAA Photo Library)
Hurricane Andrew’s right front quadrant came ashore in the vicinity of Cutler. As would be expected, the maximum storm surge of 17ft occurred in this area. Due to the storm’s fairly rapid forward speed, the most extreme winds should have occurred along the immediate coastline of Cutler and East Perrine. And indeed, the damage was astounding. Trees in the area were stripped bare, and some homes near the shoreline were unroofed and partially leveled by wind gusts in excess of 175mph. The Pinewood Villas, a one-story apartment community in Cutler Ridge, experienced some of the most severe wind damage in the area. Several apartment buildings in the complex were completely leveled, and the remaining units suffered extensive internal damage as doors were ripped from their hinges. Professor Fujita toured the damage at the Pinewood Villas and noted the inconsistent nature of the destruction, which was reminiscent of the narrow streaks of damage left by tornadoes.

At left, a seven-story Holiday Inn was gutted of furniture and some interior walls by the hurricane. At right, a view of damage in Pinewood Villas, one of the areas Professor Fujita visited. He deemed some of the building damage to be of F3 intensity. (NOAA Photo Library)
A little farther inland in Cutler, the hurricane punched through the windows and walls of large retailers and completely gutted a two-story furniture store. Due to Andrew’s incredible power and brisk westward motion, areas well inland were affected by wind gusts over 150mph. The Tamiami Airport, located 10 miles from the coast, suffered tens of millions of dollars in damage. Airplanes were flipped and rolled into piles, and the airport’s hangars were shredded to their metal frames.
During the storm, even though routine weather observations had ceased operation, the official weather observer at the airport continued to keep track of the station’s wind dial. Around 4:45am, he noted that the needle became pegged at a position beyond the instrument’s peak value (later shown to be a bit over 120mph). The needle remained fixed at this point for three to five minutes before dropping to zero as the anemometer failed. The weather observer reported that the winds increased in intensity for another 30 minutes, so it is quite likely sustained winds well over 120mph affected the Tamiami Airport (NHC, 1992).

At left, damage to the Tamiami Airport, which was located 10 miles from the coastline and north of the storm’s eye. At right, the devastated Dadeland Mobile Home Park, which was located several miles east of the airport.
Andrew was a rather fast moving storm, so winds in the northern half of the eyewall should have been more than 35mph stronger than winds in the southern eyewall. Despite the destruction in Cutler and Perrine, however, even more intense damage was found farther south. Arguably the most severe wind damage caused by the hurricane was four miles inland in Naranja Lakes, a small community just north of Homestead. The devastation was unusual because the area was near the geographic center of the storm’s path, well away from the onshore winds that affected Cutler Bay. Even more unusual, survivors in Naranja Lakes and Homestead told surveyors that the most extreme winds occurred during the back-eyewall of the hurricane. One woman in Naranja Lakes was fatally injured as her home was destroyed by southerly winds following the passage of the eye.

Extreme damage in Naranja Lakes. The home at left is where Mary Cowin was killed after being impaled by a piece of debris. At right, a streak of leveled buildings through Naranja Lakes that may have been the result of a “mini-swirl.” Eyewitness statements indicated that the most extreme winds impacted the area around 6am (Powell, 1995). While the exact conditions that led to the extreme damage is unknown, it is theorized that powerful downdrafts may have occurred within the convection cells. (NOAA Photo Library)

Aerial view of damage in Naranja Lakes. Like many properties in the area, buildings that were not leveled still suffered severe internal damage as winds entered residences through windows and doorways. (Image by Carl Seibert)
Radar views of the hurricane provided some clues as to why its southern eyewall caused such incredible damage in Naranja Lakes, Homestead and Florida City. The Miami radar failed as the leading edge of Andrew’s eyewall came ashore, and the Key West radar ceased functioning when the power went out across the region, so no radars within 200 miles of Homestead captured the hurricane as it crossed the coastline. Radar in Tampa, however, was able to fill in the gap, though with slightly less detail due to its distance. As the hurricane came ashore, radar images showed powerful convection cells forming over Homestead and nearby areas in the storm’s southern eyewall. It is likely these dense cells of precipitation led to extremely intense bursts of wind that may have reached 200mph.

View of massive convection cells in Hurricane Andrew’s southern eyewall. These features may explain why the most intense damage was not found in areas affected by Andrew’s right-front quadrant, traditionally the most violent section of a hurricane. The convection cells were not as visible in the storm’s back eyewall, where the most intense winds may have occurred, possibly due to interference from precipitation to the west.

The approximate position of the radar velocities. Areas beneath the bright orange cell include Naranja Lakes and the Homestead Air Force Base.

Images of some of the strongest hurricane winds ever filmed. At left, storm chaser Mike Theiss’s footage of the strongest hurricane winds ever captured on video during Hurricane Charley. Peak wind gusts in the film are likely between 150 and 160mph. At right, legendary storm chaser Jim Leonard captured gusts of 130mph or more whipping through palm trees in Puerto Rico during Hurricane Georges. Peak wind gusts in Hurricane Andrew may have topped 200mph.
The winds that affected Homestead, Florida City and Naranja Lakes were like nothing that has ever been filmed before. Deep convection in Hurricane Andrew’s southern eyewall likely led to near complete white-out conditions during the peak of the storm. Survivors described the roar of the storm as being so loud that “you could barely hear someone screaming next to you.” Lisa Frantz, a Los Angeles resident who survived the storm in her mother’s home in Florida City, described the impact of the storm:
The whole home shook as if it was going to be ripped from the ground. We could hear furniture banging against the walls and being blown out the windows. You could hear some of the gusts right before they hit – it sounded like jet planes were taking off right over us…I was sure we both were going to die.
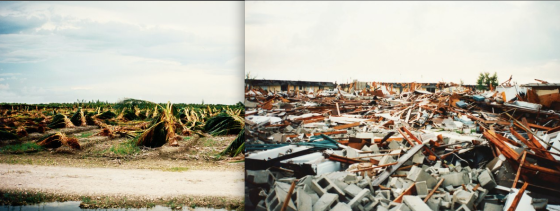
At left, saplings in a South Dade County nursery were blown to the ground by extreme surface winds. At right, a building that was completely leveled in Naranja Lakes. (Images courtesy of Michael Laca)
Unlike most US hurricanes, the majority of Hurricane Andrew’s deaths were caused by its winds. Falling trees are generally the biggest killer, but the deaths in South Florida were more consistent with tornado-related fatalities. Half of the 15 deaths directly attributed to the storm occurred in the collapse of frame homes or apartment buildings. Additionally: two men sheltering together in a metal storage trailer west of the Tamiami Airport were killed when the container was flipped several times. One man, who was also more than 12 miles inland on SW 198th Street, was killed by flying debris while running for shelter after the building he had been in collapsed. Two more deaths occurred in two separate mobile homes that were obliterated. Only one of the deaths was the result of drowning. (Natural Disaster Survey Report, 1993). A third of the deaths occurred more than 10 miles inland.
Extensive research in the decade following the storm concluded that Hurricane Andrew was significantly stronger than previously estimated (the official intensity at landfall in Homestead was originally 145mph). In 2002, the hurricane was posthumously upgraded to a Category 5 with maximum sustained winds of 175mph. At landfall in Homestead, the storm’s winds are now estimated to have been 165mph, even though the storm’s lowest pressure of 922mb was recorded at this time. The complicated and isolated nature of the wind features in Hurricane Andrew make a single intensity estimate almost impossible to calculate.
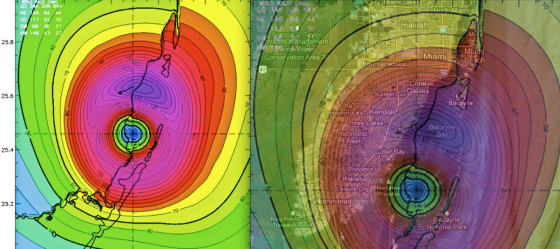
At left, view of the NHC’s updated wind contour map of Hurricane Andrew at South Florida landfall. Despite being vastly more accurate than the official intensity prior to the 2002 addendum, the contour map still is unable to account for the extreme wind damage south of Cutler Bay. At right, the contour map overlaying a map of the area.
Hurricane Andrew remains one of only three Category 5 hurricanes to ever make landfall in the United States.* The storm redefined the concept of a hurricane to a whole new generation and left lasting scars in South Florida that are still visible 20 years later. More than anything, the storm highlighted the continued discrepancies that exist between National Hurricane Center estimates and the actual surface conditions in landfalling hurricanes.


